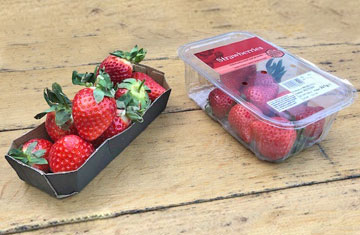
Whether you are looking for simple idea prioritisation, concept optimisation or full volume modelling, the Ink NPD model gives you everything you need.
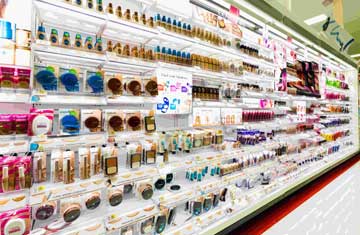
Measure: Our unique shelf-led system provides proven accuracy for product and concept potential measurement, including year 1 volume and value modelling, price sensitivity and portfolio cannibalisation.
Diagnose: Our range of diagnostic tools get under the skin of shoppers’ purchase drivers and barriers, identifying weak points to address and strengths to drive launch comms.
Optimise: The Ink team of insight specialists will help guide your development process, highlighting the critical issues to be addressed and showing what elements will drive sales in launch comms.
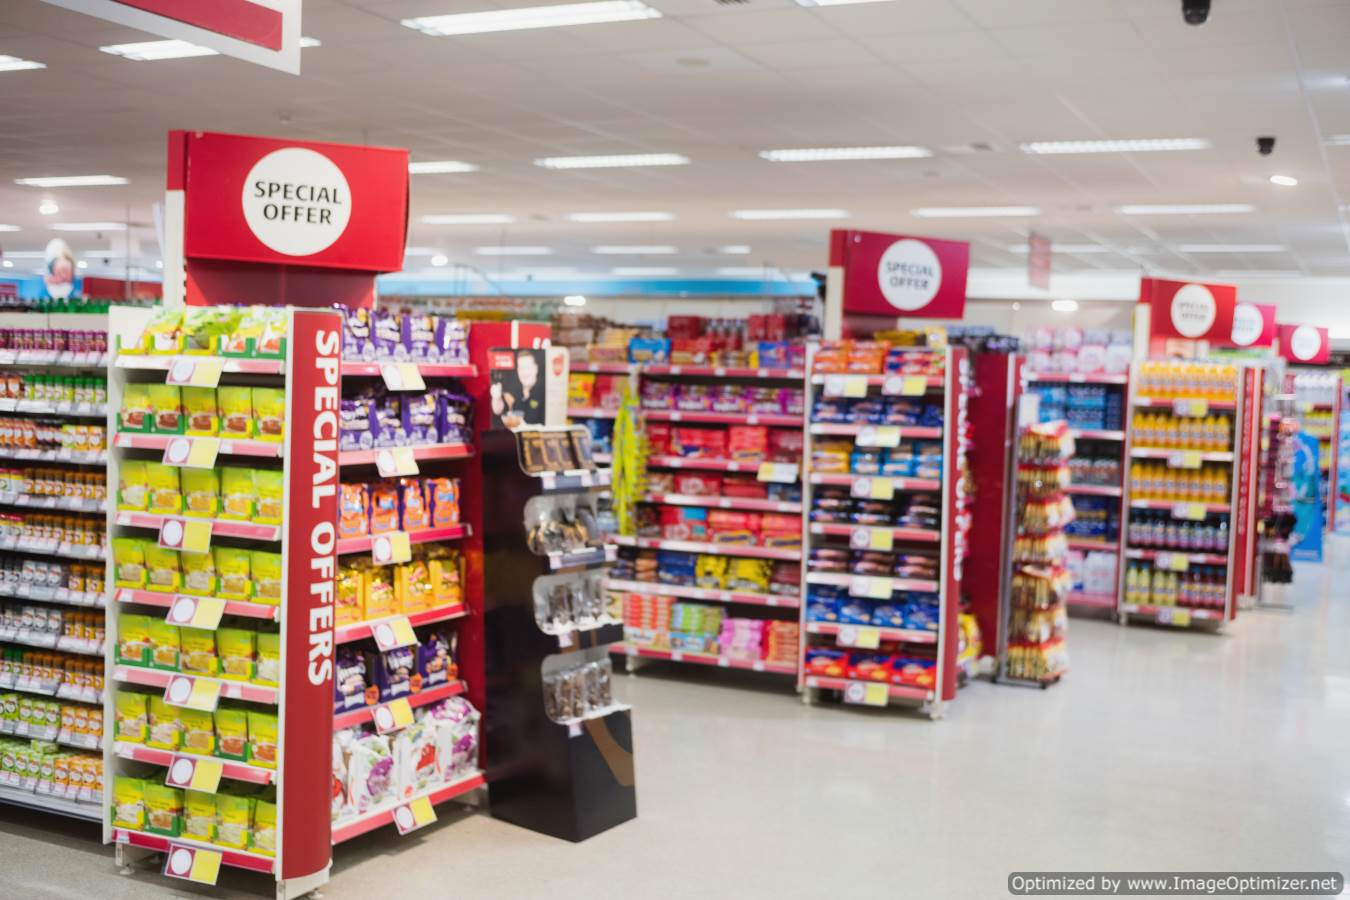
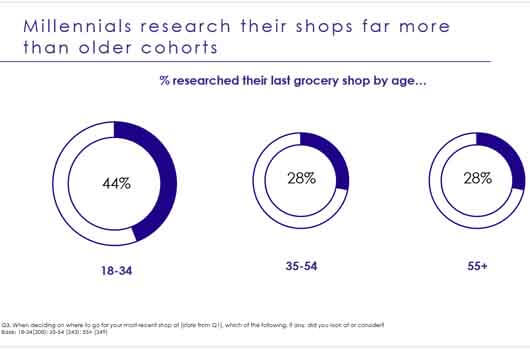
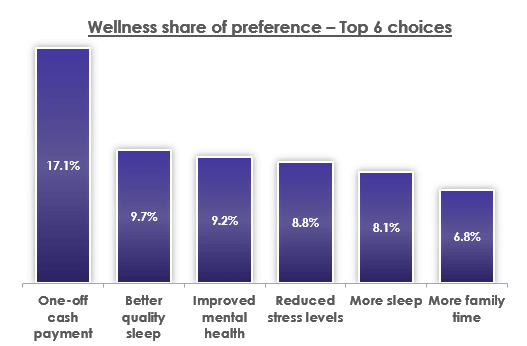
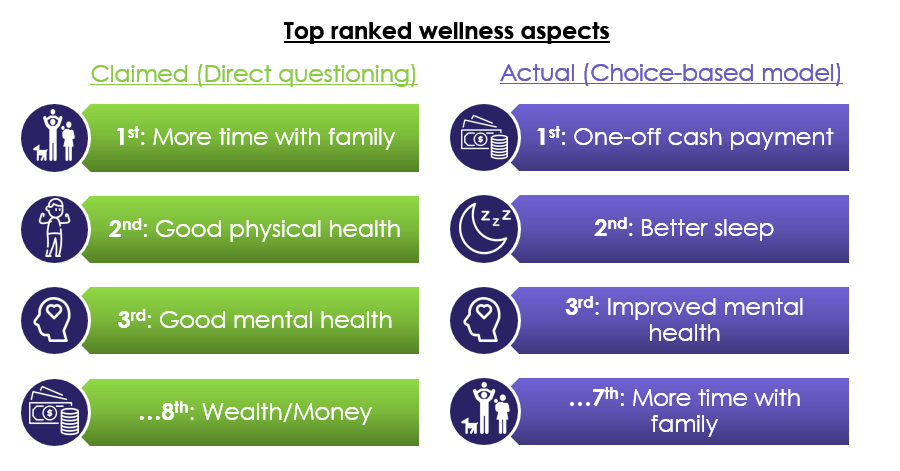
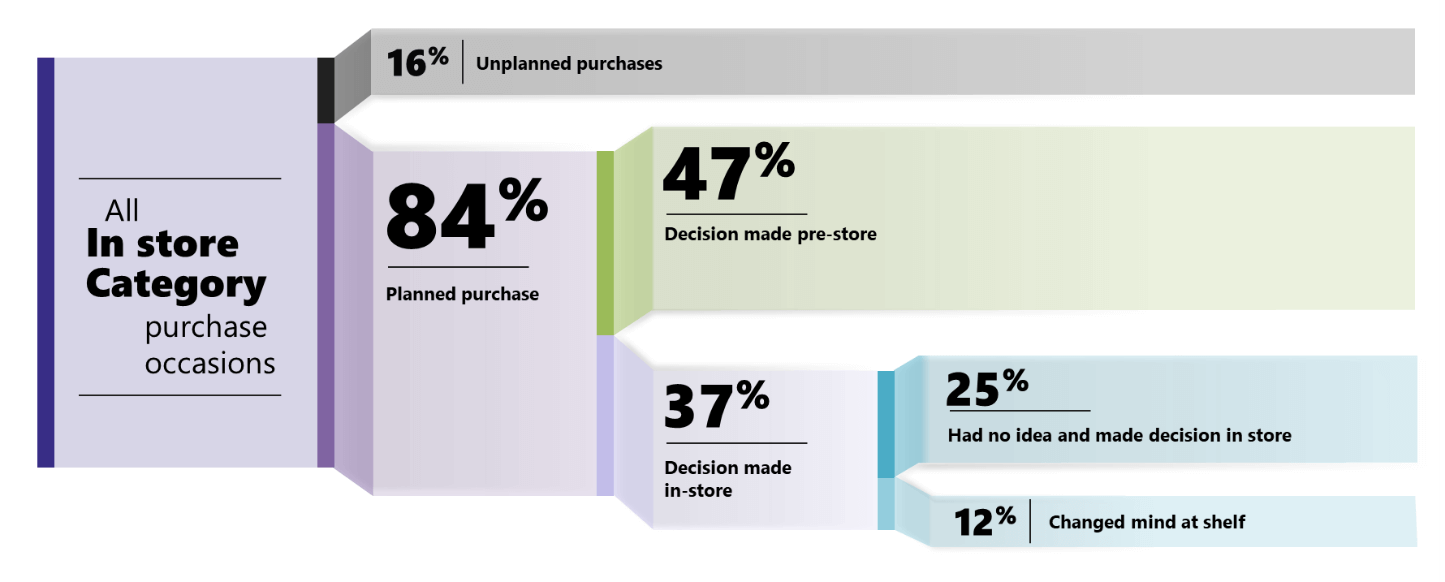
Looking to understand or grow a category, segment your shoppers or understand at shelf decisions? We know that shoppers’ purchase decisions are a complex mix of unconscious cues, heuristics, rational thinking and value perceptions. At Ink, our shopper research goes beyond rationalised questionnaire responses to get a deep understanding of the way customers make decisions are made – and most critically, why. Focusing on specific, recent purchase occasions, we put shoppers into a buying mindset, before leading them through and understanding their decision processes. Our innovative techniques are designed to give you robust insight for commercial decision making, while squeezing the most out of your research budget.
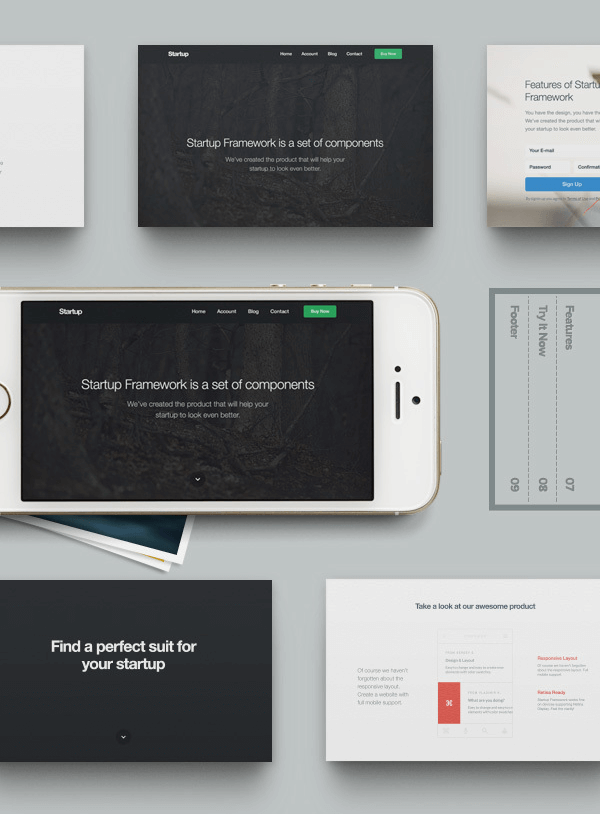
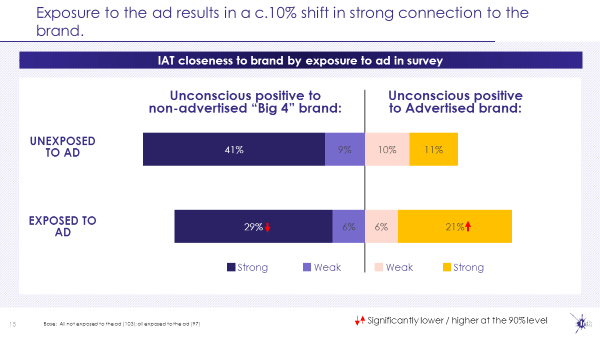
Our brand and comms tracking offering goes beyond basic level understanding and generalised, flat KPI reporting. The Ink philosophy of bespoke design and built-in flexibility, backed up by rigorous commitment to research fundamentals, ensures that trackers remain fresh and interesting even years into the future. We apply innovative analytical tools, such as control charting, to identify changes even when traditional wave on wave figure comparison lacks the sensitivity to do so. Your brand and objectives are unique – make sure you choose tracking that can support your planning and stay relevant and sensitive for years to come.
At Ink we understand the complexities of consumer decision making and behaviour and the way we go about our research reflects this: we believe in challenging the way research is done, re-evaluating research in the light of emerging knowledge about decision making processes.
We focus on matching our research to the way decisions are made in the real world: a mix of conscious and unconscious, impulse and list driven. We understand the power of the shelf in purchase decisions and measure accordingly. We have a healthy distrust of human memory and get that shoppers often can’t or won’t tell us why they are making certain decisions – so we use a range of implicit and modelled techniques to give us insight into real world choices.
We translate our research into concise, business-focused and above all, actionable insight. We pride ourselves on delivering tailored results in a format that’s just right for our clients’ key stakeholders. We know you need to demonstrate the ROI of your research – and that’s what we aim to do on every project.
Research quality is fundamental to our offer. Our research is conducted with a deep understanding of the fundamentals of market research, developed over 25 years of industry experience: we work with only high quality sample providers, design concise questionnaires which elicit the most revealing insight and use sophisticated analysis techniques to get under the skin of the data. In short, we concentrate on the quality of the insight so that our clients can work on implementing it.
Managing Director
Director
Research Manager
Use this area to describe your project. Lorem ipsum dolor sit amet, consectetur adipisicing elit. Est blanditiis dolorem culpa incidunt minus dignissimos deserunt repellat aperiam quasi sunt officia expedita beatae cupiditate, maiores repudiandae, nostrum, reiciendis facere nemo!
Want these icons in this portfolio item sample?You can download 60 of them for free, courtesy of RoundIcons.com, or you can purchase the 1500 icon set here.
Startup Framework is a website builder for professionals. Startup Framework contains components and complex blocks (PSD+HTML Bootstrap themes and templates) which can easily be integrated into almost any design. All of these components are made in the same style, and can easily be integrated into projects, allowing you to create hundreds of solutions for your future projects.
You can preview Startup Framework here.
Treehouse is a free PSD web template built by Mathavan Jaya. This is bright and spacious design perfect for people or startup companies looking to showcase their apps or other projects.
You can download the PSD template in this portfolio sample item at FreebiesXpress.com.
Start Bootstrap's Agency theme is based on Golden, a free PSD website template built by Mathavan Jaya. Golden is a modern and clean one page web template that was made exclusively for Best PSD Freebies. This template has a great portfolio, timeline, and meet your team sections that can be easily modified to fit your needs.
You can download the PSD template in this portfolio sample item at FreebiesXpress.com.
Escape is a free PSD web template built by Mathavan Jaya. Escape is a one page web template that was designed with agencies in mind. This template is ideal for those looking for a simple one page solution to describe your business and offer your services.
You can download the PSD template in this portfolio sample item at FreebiesXpress.com.
Dreams is a free PSD web template built by Mathavan Jaya. Dreams is a modern one page web template designed for almost any purpose. It’s a beautiful template that’s designed with the Bootstrap framework in mind.
You can download the PSD template in this portfolio sample item at FreebiesXpress.com.
So you’ve identified where you are going next with your NPD – you have a great new line or product that has tested well and the teams are finalising its formulation, features and price.
But how does it fit with the rest of your product line? And where does it stand against competitors? Does it maximise the potential of your portfolio? Are there small changes you can make to prices, range or features that could get you that elusive extra share?
These are questions that are not asked – or at least not answered – often enough. Shelf and concept testing will get part of the way to the new product’s strength, but will not give the detail needed to fully optimise your whole portfolio on product launch.
This is where a conjoint exercise can fill in the gaps. Conjoint provides each respondent with a series of choices between different products and brands, each with a range of features and prices. From the responses to these limited options, we can use a sophisticated model to predict what shoppers would choose in a vast range of different scenarios.
In a recent study, our client wanted to understand how a new product range would fit with the rest of its portfolio. The NPD team had developed 6 variations, but could only launch up to 4 – the key was understanding which should be launched, which from the current portfolio could be retired and how to set the pricing strategy to maximise return.
The client also had another item on the wishlist: quantify the value that customers placed on each feature – giving the NPD team a direction for future development.
The Ink team worked closely with our client to understand the parameters – which features could be varied, what prices were realistic and what parts of the portfolio could and could not be changed. We designed a conjoint exercise with 14 products, each with up to 8 varied features and 5 price points. This was implemented across three markets among over 3,000 respondents.
The results, as with any well designed conjoint, were incredibly rich:
For more information about how we can help with your NPD, either via Conjoint or our unique
shelf-led NPD volume predictions, contact:
Barry Noble, Managing Director
barry.noble@inkmr.com, 07969 815274
This may be surprising for non-researchers to hear, but there are questions frequently asked in consumer research which respondents NEVER answer accurately.
This is not because respondents are deliberately lying, but because they do not typically think about these questions in their daily life. Take purchase frequency, for example. Most people would think they have a good idea of how regularly they buy products from supermarkets. However, for most respondents, that is simply not the case: shoppers wildly overestimate or underestimate purchase frequencies in survey environments.
Complicating matters further, the amount by which consumers overclaim or underclaim varies substantially by category (so we can’t simply apply a factor to claimed responses): The overclaim effect tends to be more pronounced for low involvement FMCG categories, while alcoholic beverage purchasing is often understated.
So, how can you ensure that the insights you’ve paid for are based on real behaviour?
Experience and know-how are required to know which questions tend to be answered incorrectly. However, the answer is not necessarily to avoid asking them; they are essential to answer some critical business questions. In these cases, we can correct and recalibrate responses to find the real answers.
For each measure which could be overstated, the key to understanding the true insight is to identify the factor by which responses are overclaimed. To do this, we test a benchmark cell replicating real market conditions, and compare with actual market data.
Comparisons between the benchmark survey data and real data demonstrate the extent to which we need to calibrate our survey responses to match real behaviour. We can then apply this to any scenario we are testing.
This approach can be used simply to understand shoppers’ true behaviour compared to claimed data, but if we apply a modelling element, it can also be used to forecast sales from claimed responses.
We recently ran a project investigating whether resiting our client's SKUs to a different fixture in store would boost category volume and value. For this complex task we simulated several journeys through store in a survey environment, with half of our sample seeing the original store layout and half seeing the proposed new siting.
We took market data for the category and competitive categories, including past 2-year data for purchase frequencies. Using this, we calibrated survey data for the current scenario simulated shop to reflect market realities.
We found - for instance - that our client’s SKUs were “bought” significantly more often in the survey than would be expected from sales data, so we calibrated downwards in both this and the projected scenario. We applied these calibrations across a range of modelling elements – most corrections were only small, but combined, potentially contributed significantly to the final results.
Once these were factored in, we could understand how survey data would translate into actual sales figures for the new scenario. This allowed us to demonstrate, simply and precisely, which scenario would result in higher sales volume and value for our client's brand, and the category as a whole.
At Ink, we understand which questions consumers have trouble responding to, when to avoid using them, and how to coax useful insights out of them. To discuss how we can help you get the answers you are looking for, contact:
Caspar Swanston, Associate Director
caspar.swanston@inkmr.com, 07789 208611
John Wanamaker (in)famously claimed: “Half the money I spend on advertising is wasted; the trouble is I don't know which half.” But could that apply equally well to your instore marketing?
Our path to purchase research suggests that almost HALF of all decisions on what to buy in UK grocers are pre-determined (i.e. made pre-store with no consideration for alternatives). Instore marketing will have little impact on shoppers who have already made their minds up. Is your spend targeted efficiently to take advantage of the purchase occasions which can be influenced by shopper marketing?
The 47% of shopping occasions where the consumer has already made their mind up are not open to disruption. These are unconscious, fast, and non-comparative decisions (“system 1” decisions in behavioural economics terms), driven largely by prior usage.
A good shopper marketing approach should focus on those occasions which are open to disruption - the other three occasion types outlined in the above graphic.
Purchases during these types of occasion are driven by different needs to pre-store decisions and have more leverageable drivers (price, shelf stand out, messaging etc.). Consequently, each one requires a bespoke instore approach.Of course, you should not abandon the ~47% of pre-decided purchases. These should be targeted through brand building; widening top of funnel and building brand closeness to ensure you are top of mind for these more sub-conscious decisions.
Our approach to category optimisation research approaches the path to purchase through this framework. We map how to best allocate resources by focussing on the disruptable purchase paths. This enables us to identify the most profitable of the purchase paths and advise you on how to target, so you are not wasting money on uninfluenceable occasions.
Our model also incorporates brand salience and image to target pre-store purchase decisions. This panoramic view of the category avoids the pitfalls of traditional category testing, which traditionally focuses on either usage and attitude, or P2P. Our holistic approach explores all areas where your brand may be underperforming.
To hear more about specific case studies, or to hear how we can help with your shopper marketing, get in touch.
Caspar Swanston, Associate Director
caspar.swanston@inkmr.com , 07789 208611
A good friend and I have an ongoing conversation (/argument) about the decisions he makes in supermarkets. He maintains that as a scientist and logical thinker, every choice he makes is comparative and thought through. He gets to the shelf, evaluates what’s available at what price and makes a fast, but considered choice. For every product. In every category.
He’d be a vanishingly unusual shopper if this were really the case.
We all take short cuts every time we shop, saving ourselves the mental effort of making hundreds of unnecessary decisions – we quickly single out and choose our usual brand, our usual product, from the vast array of alternatives available to us. Indeed, Ink’s work on decision paths suggests that around half of all of our UK grocer decisions are made long before we get to the shelf.
From a researcher’s point of view, we have to step back and ask whether we do enough to recognise these decision paths when we conduct our market research?
At Ink we design our research through the lens of real shopper decisions. Our NPD Model has been using decision path theory to give us more accurate and actionable testing for years; and another area we think requires the decision path treatment is range and price optimisation.
Our preferred approach for optimisation is choice-based conjoint: showing shoppers carefully curated sets of choices with varying ranges, features and prices, before modelling results to allow us to find optimum combinations for different line-ups. We love conjoint – it is established, flexible, powerful and, in many ways, replicates the way we make decisions at shelf.
But it also makes a dangerous assumption – that product choices, while made quickly, are nevertheless done in a considered and logical way, scanning the range and making a judgement as to the best option to buy (my friend’s claimed approach to a tee!). Clearly this is simply not the case for every purchase decision.
We could, of course, just ignore the fact that conjoint doesn’t match real decision paths. Research is, after all, always only an approximation of real life.
But that’s a mistake for optimisations like this: product choice on occasions which are made pre-store are heavily weighted in favour of big brands. So by ignoring decision paths we are distorting the real choices people will make – giving smaller, less well known brands, more weight than they would really have in real life.
Our conjoint modelling builds in corrections for pre-store decisions. It uses our path to purchase understanding and results to apply restrictions that get us far closer to replicating real world decisions – making our range and price optimisations far more accurate than the traditional approaches.
Of course, we don’t stop there! We can also build in modelling that takes into account:
For more information about how we can help with your NPD, either via Conjoint or our unique
shelf-led NPD volume predictions, contact:
Barry Noble, Managing Director
barry.noble@inkmr.com, +44 (0)7969 815274
For most of us the last year has been exceptional, causing huge disruption to our usual way of life, our mental and physical wellbeing, and the economy. Our long-established life patterns have been challenged which has clearly also had an impact on how we shop. The shifts to online shopping and less frequent, bigger basket trips have been well documented but we have also seen changes at a more micro level, with brand and product choice also affected by the pandemic. With “Freedom Day” just around the corner, we are all very much hoping that things will start to go back to normal, but the jury is still out what the ‘new normal’ will look like across all aspects of life including purchase behaviour.
Given our focus on FMCG at Ink, we have had lots of conversations with our clients over the past year on how the pandemic has impacted consumers’ needs and how well-established shopping behaviours have changed across categories as a result of Covid-19. Some of the questions that kept re-occurring included:
In fact, one of our clients challenged us to identify how product choice was currently influenced by Covid as part of a strategic range review, looking at whether the planned optimisation across their brand portfolio was going to continue to be relevant in a post-Covid world.
Now, we all know that the only way to scientifically establish to what extent shopping behaviour has changed is to compare two points in time, in this case pre and mid-pandemic - differences in brand preferences can then at least partly be attributed to Covid-19. Telling our clients that they would have to use a time machine to go back to February 2020 clearly was not an option, so we set about finding a more realistic solution to optimise their portfolio in the short-term whilst also future-proofing the changes to their range for when the pandemic has, hopefully, been contained.
To establish the best brand and SKU product line-up, we started off with a choice-based approach, using a standard conjoint method with lots of products tested at five different price points. Grounding the exercise in their most recent purchase occasion (less than three months ago), we asked respondents to make real choices based on different product options in front of them, giving us thousands of choices and different product line-up scenarios to identify the products that are currently most popular among shoppers in the category and advise which brands, SKUs and prices to adopt.
Once we had the full pandemic-based results, we were then able to adapt our model to carefully chosen control measures designed to give us a picture of what the results might have looked like had we conducted the research pre-pandemic. Using brand and product sales data and purchase frequencies pre- and mid- pandemic, we built a new version of the model weighted to tell us how choices might look if all shopping went back to “normal” levels.
Comparing results of the model from the current and pre-pandemic weights, we were able to advise our client what the impact would be if we assumed a complete return to pre-covid shopping.
Interestingly for our client, results were strengthened when the pre-Covid weights were applied, suggesting that the strategic move to optimise their brand portfolio was going to be a success in the short time while the pandemic was still on-going but had the potential of carving out further incremental sales if shopping behaviour were to go back to pre-pandemic levels.
So, whilst we were unable to predict whether changes in shopping behaviour are here to stay or go back to normal (we suspect a middle-ground), our method allowed our client to future proof their strategy in the face of Covid-19.
To find out more about this study or how we can help you with shopper research, contact us at:
Praxedis Page, Director
praxedis.page@inkmr.com, 07828010343
Brand tracking divides marketers. For some, it’s a critical tool worth investing in, to ensure they can show the evidence that their brilliant marketing plans are working; for others it’s simply a money-wasting, box-ticking exercise (sales figures are king, right?).
Unfortunately, many in the latter group have had bad experiences with brand tracking – too many have seen flat, uninspiring data that is difficult to translate to brand planning. Marketing activities often have only subtle effects on the brand funnel; standard brand tracking, with affordable sample sizes, can struggle to confidently pick up these longer term changes.
Of course, they could increase the number of people interviewed in their tracking to make it more robust – but who signs off more budget for a tracker that is not delivering?
Enter control charting. Control charting was originally devised by Bell labs right back in the 1920s to check whether the size of the “widgets” on a production line was changing over time. Standard statistical approaches often took too long to identify an issue, wasting time and money.
So, they designed a relatively simple approach in which they observed how many widgets in a series fell consistently above or below the average – too many in a set in one direction and they could be confident (statistically) that sizing was slowly going awry.
Control charting can work in the same way for brand tracking. Without needing to increase sample sizes, control charting can tell us with real confidence whether a measure has increased consistently vs. a previous period.
Of course, all of the brand tracking basics have to be right for control charting to be of value: Your brand funnel and image questions have to be sensitive enough; your competitive set has to be right; your sample has to be your exact audience, ideally segmented in a way that allows us to break them down (and control chart them by segment!).
But control charting offers a statistically robust and highly accessible way of making your brand tracking go further – reinvigorating it into a tool that is built bespoke for your brand and marketing planning.
To find out more about control charting or to hear how Ink can help your business track brand success, contact:
Barry Noble, Managing Director
barry.noble@inkmr.com, +44 (0)7969 815274
The movement to reduce our plastic use has gained significant momentum in recent months, driven in no small part by Blue Planet II. Shoppers all like to think they’re doing their bit and the media is full of surveys in which they claim they would change behaviour – and pay more – to help the environment.
Rather than just ask about what people would pay for, we took a more implicit route. We gave shoppers a series of purchase choices for supermarket strawberries, before our clever friends at Marquant modelled the results to measure the value of different features such as price, fair trade, provenance and packaging.
Our findings – which compared real choices to how consumers claimed they would behave in direct questioning – were revealing:
Price is by far the most important element in shoppers’ decisions – no surprise there. What is surprising is that locally sourced foods can command a far higher premium than any of the other elements we measured – including plastic free (or indeed wholly bio-degradable) packaging.
This was despite shoppers claiming in the direct questioning section that plastic-free and UK sourcing were about equal.
Part of this could be a “strawberry effect” here – good old British strawberries being better than those abroad. But the extent of the difference was astonishing: shoppers were willing to pay 82p more on average for a product marked as being from a local farm (and almost as much for just UK sourced).
That’s more than twice as much of a premium as plastic-free packaging commanded!
Nonetheless, shoppers are still keen to do their bit and are happy to pay extra for a product that doesn’t come in plastic – in our strawberry study the “plastic-free premium” came to 39p. That’s not an insignificant price hike, but may not be enough for retailers to offset the investment required for non-plastic packaging, not to mention any gain in shelf life plastic brings. We also included wholly biodegradable packaging as an option and this did command higher prices, but only marginally so at 43p extra. It seems plastic-free is gaining ground not just in publicity terms, but in real value to shoppers too.
It’s not so rosy a picture for organic and fair trade products – despite shoppers’ belief that it is important to support farmers and that organic food is worth paying more for, consumers are far less willing to pay a significant premium on these things in real life. In our study, shoppers would only pay 12p and 15p for organic and fair trade produce respectively – far less than they predicted they would pay.
Well, for manufacturers and retailers , the plastic-free revolution continues – there’s clearly already a brand image, PR and CSR advantage to be had through investing in eco packaging. But will there be a tipping point where the premium shoppers are willing to pay makes commercial sense to invest in?
For marketers and researchers , the message is clear – shoppers can’t (or won’t) always accurately predict their own behaviour when asked direct questions. We have to be clever about how we approach shopper insight and understand that survey responses can’t always be taken at face value.
The study threw up all sorts of interesting details about shopper behaviour – including big differences in Millennials vs. Gen X and Baby Boomers and insights into shoppers at different grocers. To get a more detailed run-through, contact us at:
To find out more about this study or how we can help you with shopper research, contact us at:
Barry Noble, Managing Director
barry.noble@inkmr.com , 07969815274
The recent industry focus on shopper decision making at shelf has been on “unconscious” decisions: consumers buying everyday brands without any engaged thought processes, the purchase instead triggered by “heuristics” and branding cues. But for new products, the decision process is necessarily different; to encourage purchase of a new product on shelf, the brand must disrupt the usual shelf experience and force shoppers to make a considered decision in which they compare the new product with others on shelf.
Our research backs up this thinking. Among a set of new product releases for well known brands (all of which had received significant marketing support) the majority of shopper decisions are made at shelf, with only a quarter being driven purely by in-market activity and word of mouth:
Most traditional NPD research concentrates on understanding reaction to a concept – i.e. testing a product in isolation from its competitors. But, as we have seen, this is not how most decisions are made in the real world – the concept test route misses out on the key comparative shelf element of the decision.
Other testing routes flip this around completely by concentrating the research wholly on a mocked-up shelf. Again, however, this misses out on a key element: the support that a brand gives a new launch which reinforces the messaging and directs shoppers to find the products in store or online. Using only a shelf also significantly restricts the detail of diagnostic feedback research can provide.
Just as in real life, the Ink NPD model has shoppers assessing the new product both at shelf and concept in turn. Half of our sample sees the shelf first (replicating those who come across it on shelf first in real life) and half see the concept first (mirroring those who see some brand support before going in store). Results are then modelled, weighting the relative shelf and concept scores to provide a Market Potential Score and year 1 value and volume predictions – real world figures which feed directly into our clients’ new product development processes. The Ink NPD model not only replicates real life purchase decisions more closely, but gives us an understanding of:
For the full thought piece or more information on the Ink NPD Model or the study we conducted,
contact:
Barry Noble, Managing Director
barry.noble@inkmr.com, 07969 815274
A client recently challenged us at Ink to think about the Behavioural Economics of supermarket choice: Specifically, how much of choice was ingrained, unconscious and "fast". And how much was more considered and comparative. We speculated that while most people will at some point make rational comparisons between grocers, almost all individual grocery trips would be "fast".
Our recent study addressing precisely these questions among a representative group of 1,000 UK
adults generated some fascinating insight:
Powerful though these insights are, one thing stuck out considerably more:
This was interesting at first – of course, we thought, younger groups research their supermarkets more because they've grown up with the internet and are more likely to be online. And we were right – Millennials are far more likely than the older groups to research via sites and apps, particularly the supermarkets' own.
What came as more of a surprise was the fact that Millennials used more offline tools too. They were more than twice as likely to use store magazines and leaflets than those over 35 and more than three times as likely to admit to considering advertising to decide where to shop.
Millennials, it seems, are simply more comfortable with making comparisons and are less brand loyal
(or brand centric) than the older cohorts when it comes to shopping for groceries. This is despite
evidence that this age group tend to be more loyal to brands they respect and feel close to.
Our hypothesis is that this is likely to be due to a combination of their comfort level with the
vast number of comparative information sources available to them and a financial crisis-driven
outlook which has forced recent frugality and savviness upon this generation.
The question is: Is it an ingrained attitude that will remain into their later life or will the
Millennial generation morph into the same, less considered decision making their older relatives
display. Given the relatively little difference between the 18-24s and 25-34s on this, our money is
on the former – this generation simply being more choosy and considered in their supermarket
choices.
Whatever the reasons, it seems to be good news for advertisers – particularly those targeting
Millennials. But less good for the non-discount supermarkets.
For more information on this thought piece or more detail on how we conduct our shopper research,
contact:
Barry Noble, Managing Director
barry.noble@inkmr.com, 07969 815274
Our client, a large food producer, wanted to re-invest in a category where innovation had been lacking across the market, but had little consumer-focused evidence to base their investment decisions on. Our brief was therefore very broad:
Our first step was to work with our client to mine the internal stakeholders’ knowledge – the
category managers and insight director were able to give us a deep overview from the business’ point
of view, as well as some hypotheses about where they (and the retailers) thought the opportunities
might lie.
We then collaborated with our qualitative partner, Qual Street, to understand the shape of the
market – they were able to identify a series of characteristics that we could then test:
Add in the different retailers that the client wanted to look at and it was clear that we needed to get to extremely granular results to meet the objectives.
Our first task was to secure the robust (and in some cases very low incidence) samples we would need
for the project without busting the budget. To do this we worked with a fieldwork partner to
pre-screen their UK panel – giving us cost-effective access to the sample we needed for the project.
We then worked closely with Qual Street to put the needstates, occasions and formats into consumer
language for the quantitative questionnaire, as well as devising attitudinal statements to feed into
sizing the consumer typologies. The questionnaire concentrated on specific occasion-based feedback
to give us real world*, actionable and accurate results.
The pre-screening gave us a really robust 1,700 interviews, including:
We concentrated on FIVE CONCRETE RECOMMENDATIONS FOR GROWTH, each of which we
classified by:
Size of the opportunity – giving a steer on how to allocate resources
Ease of implementation – showing which were short term wins and which required
longer term investment
For each opportunity we provided a framework for how it could be achieved – who to target, messaging and in-store comms, as well as more specific elements such as NPD, pack or product changes. And because of our robust base sizes we were also able to provide retailer-specific outputs and recommendations.
* Avoiding generalised and bland results
We know from experience and Behavioural Economics thinking that shoppers find it difficult to
accurately recall all of their category use occasions – their memories will often focus on the most
regular at the expense of other, smaller occasions, giving us a skewed picture of the market (and
often missing out on the most important growth opportunities).
We therefore concentrate on single, real occasions (usually the most recent occasion). We spread
interviewing over several days to give us a representative view of occasions and investigate each in
depth to measure behaviours and identify core barriers and opportunities.
For more detail on the study or more information on how we go about category deep dives,
contact:
Barry Noble, Managing Director
barry.noble@inkmr.com, 07969 815274
The market leader and the pioneer in their field, our client (an online retailer) was coming under
increasing pressure from new me-too market entrants. Following extensive customer research they came
up with a newly refreshed product offer, with a lifestyle rather than function focus. As the launch
date came closer and the range detail became clearer, the business needed a detailed, quantitative
understanding of:
Critical for the business was to measure the switching process, putting solid numbers behind which customers would switch to which products, feeding into forecasting modelling.
To complicate matters further, our client needed results within a week in order to be able to launch the new product range on time. So not an easy feat – exactly a challenge that we at Ink were delighted to help with!
Those familiar with Ink will know that we place huge importance on research staying as close to
reality as possible and on replicating how people make decisions in real life. We therefore worked
closely with our client on the look and feel of the range concepts and reproduced the way the
products are displayed on our client’s website.
So, current and lapsed customers evaluated the new range as if it were already online – for these
groups it was easy to compare to what they currently (or used to) get and decide whether they would
continue buying (or start again).
Potential new customers were a little more difficult. These we split into two – one exposed to the
current range and one to the new (in real life they would never see both ranges, so we didn’t show
the two side by side in this test either). The difference between those who saw the current and the
new gave us the likely impact on acquisition.
We presented the results hot off the press – the day after the fieldwork completed! – to all teams involved in the re-launch. The research gave a clear indication of the new range’s likely impact on our client’s sales figures with regards to their retention, re-engagement and acquisition strategy. The debrief was followed up by a series of meetings with the forecasting and comms teams to define the launch strategy and to plan the most effective messaging campaign when transitioning from the current to the new product range.
For more detail on the study or more information on how we go about concept testing, contact:
Barry Noble, Managing Director
barry.noble@inkmr.com, 07969 815274
It’s only in the last few years that wellness – defined by the WHO a “state of complete physical, mental, and social well-being, and not merely the absence of disease or infirmity” – has begun to grow into a commercial force to be reckoned with.
The growth has been evident across a wide range of categories, from technology (in particular apps and wearables) to the dizzying array of herbal and other OTC products and alternative foods. At Ink, over the past 2 years we’ve been tasked by clients from FMCG, media and tech to help them understand the surge in wellness’ popularity and what it means for their businesses.
But how much of our view of the growth of wellness is based on the fact that we live in a professional urban “bubble” – are we assuming it’s everywhere, just because it’s a focus for some of our clients, when it’s actually not the slightest bit relevant to the everyday shopper? And how committed are people to achieving wellness benefits – if it was a choice between wellness and old-fashioned hard cash, how would they react?
We set out to find out. We first asked 500 representative UK adults what they prioritised in their lives in absolute terms – a range of wellness benefits vs. wealth and salary. We then gave them a series of choices (using a “MaxDiff” design, for the researchers out there) and then modelled the results.
Despite this, cash was the most chosen option – because all of the individual wellness benefits were chosen by relatively small numbers of people. And it’s not just that there were lots of benefits available, so responses to each one were diluted – our modelling allowed us to isolate and compare pairs of benefits to see which would be chosen most. Compare cash to any individual benefit one-to-one and cash wins out every time. Even those who claim to suffer from a particular problem – those who don’t sleep well, for example – are still more likely to choose cash over improving their condition. The implications for businesses looking to take advantage of the wellness trend are significant: either target one wellness area and accept the relatively niche nature of the market or somehow try to bridge all areas and know that most people will be prioritising just one (and that the business will be competing with others who are specialising in each individual wellness area).
While the market as a whole is clearly fragmented, there are a group of people who will pretty much always choose a wellness benefit over a cash alternative. This relatively big segment – representing almost a third of the population – are the clear sweet spot for the industry. They have a clear demographic and attitudinal profile that makes them relatively easy to target (get in touch with us if you’d like to hear more).
One wellness benefit tested – “practicing mindfulness” – performed particularly poorly: it was only prioritised by c.2% of respondents, the second least chosen attribute: it seems that using terms such as “mindfulness” still does not resonate with most shoppers. However, change that to more everyday language and the number choosing it goes up considerably – both “time to spend on yourself” and “time to spend unwinding / destressing” did significantly better than “mindfulness”.
While these more common phrases might not have the same intrinsic meaning that that “mindfulness” encompasses, they are clearly more acceptable to the average shopper – so for those in the wellness space looking to appeal to a wide audience, careful messaging will be key.
As with a lot of our studies, part of the objective of this exercise was to explore the difference between asking people directly what their priorities are and using a choice-based model to measure priorities more indirectly.
For wellness the differences between direct and indirect questioning were perhaps more stark than for any other study we’ve done. We all like to think of ourselves as prioritising our family and friends, concentrating on our own mental and physical health and getting a good work/life balance over more materialistic gains – and that’s exactly what we found when we asked people to prioritise without having to make any choices or compromises.
But when it comes down to the stark choices of a one-off payment vs. wellness benefits, the cash inevitably has a bigger draw than we think it should! In fact, materialistic gains go from eighth highest priority in the direct questioning to first in the MaxDiff exercise.
The wellness max diff study has given us a unique view into the wellness arena. The model – which we’ve translated into an easy to use excel simulator – allow us to look at a vast range of scenarios and break down responses to give truly granular insights. To hear more about it, drop us a line.
Barry Noble, Managing Director
barry.noble@inkmr.com, 07969 815274
Brand tracking can divide marketers. For some, it’s a critical tool that’s worth investing time and budget to ensure it can show the evidence that their brilliant marketing plans are working; for others it’s simply a money-wasting, box-ticking exercise (sales figures are king, right?).
You won’t be surprised to hear that at Ink we are firmly in the former camp – at its best, tracking is a robust, but rapier sharp tool to set your strategy, hone your execution as the year progresses and feed into the next phase of your plan.
Unfortunately, that’s not every brand’s experience. Unfocused, poorly executed research is more prevalent than it should be and this has given tracking a bad reputation among some marketers.
Having championed tracking throughout my career, I’ve often talked in depth with client researchers and marketers about what’s gone wrong for them and I thought it might be useful to try to summarise the big pitfalls.
(As a start point I’ve assumed you have chosen a strong research agency that gets well constructed, fresh, matched groups of respondents for you each wave – otherwise tracking goes from useful to damaging lighting fast!).
So, here goes, my top brand tracking pitfalls are:
You’re using a well known tracking approach from a world renowned agency – surely it will give you everything you need?
But that’s a lazy approach. You wouldn’t dream of using a pre-defined marketing plan for your brand (would you?). Your plan is bespoke for your brand and you need a tracking study that is specific to it in order to properly measure its success. Granted, if you’re just starting out in the planning you may need an orientation or foundation study to give you the current positionings, strengths and potential opportunities; but tracking research is not a fishing trip – you know what you want to achieve before you start it and the tracking should reflect that.
Of course, you need to have an agency that can translate your needs into a business-useful research programme. And to do that, you need to trust them with the details of your long term planning.
But the tracking should be as individual as your long term plan is for your brand.
Of course, consistency is key for your core measures – you have to think long and hard before making changes to anything central to the brand strength and image part of a tracker.
But unless you bake in flexibility, it’s going to lose relevance and usefulness very quickly. Your business and marketing plan evolves over time – and so should your tracker.
Like everything else in your planning, brand tracking needs to offer good value for money – and there’s a temptation to shave a bit off the costs with less frequent interviewing. Surely quarterly interviewing – or even an annual dip – gives us enough to see where the brand’s heading?
But it’s a false economy. Interviewing more frequently – at least monthly – tells us so much more about the brand and market; and the cost savings of not doing it this way are negligible.
By interviewing monthly (or more often) we can start to look at the cause of changes over time – we can look at the effect of your and your competitors’ activities, allowing you to adjust your planning accordingly. An annual or quarterly dip will tell you what’s happening, but you need more often to get to the critical “why”.
Your agency should advise on how many people to interview based on your needs and marketing plans – but there’s always the temptation to cut that back to save budget.
Listen to your agency! They know what is needed to be sure results are reliable and robust – they will be able to give you a clear explanation of why they have recommended a sample and what the consequences of cutting that back might be. The last thing you want to see is tracking data with unexplained movements because the sample is not robust enough – it doesn’t give anyone confidence that the tracking is doing it’s job.
To find out more about control charting or to hear how Ink can help your business track brand success, contact:
Barry Noble, Managing Director
barry.noble@inkmr.com, +44 (0)7969 815274
Ask the average man or woman in the street and they’ll tell you advertising doesn’t influence them. At a stretch they may concede that advertising helps inform about what’s available and how products are different from competitors, but nothing beyond that.
Brand owners, ad agencies and, in particular, creatives all know this isn’t true: the most powerful advertising connects with audiences on an emotional level, subtly shifting unconscious connections with a brand and edging shoppers closer to a purchase decision.
Techniques exist to measure this unconscious effect (biometrics do a very good job), but they tend to be difficult and expensive to implement, particularly with robust samples of participants. This inability to measure unconscious connections cost-effectively is an issue at the centre of the ongoing hostilities between creatives and (quantitative) researchers.
And, as measuring decision paths is right up our street at Ink Research, it’s a conundrum we’d love to get under the skin of.
So we were more than a little excited to make our first foray into applying an Implicit Association Test (IAT) to the problem. IAT is a decades old technique which has recently undergone somewhat of a resurgence – it was originally designed to measure unconscious social biases in areas such as race, sexuality and gender, but, with the right application, can be used to measure almost any aspect of unconscious connection.
IAT steers away from direct questioning, instead relying on an online “game” in which we measure the time it takes (in milliseconds) for respondents to sort brands and words into different groups; the speed with which they can sort elements together indicates (via a little statistical magic) how well they subconsciously connect them with each other.
We tested IAT on two well known supermarket brands – one discounter and one of the “big four”. We exposed half the sample to the discounter’s (emotionally-driven) TV ad and asked all to complete the IAT sorting game and answer some more traditional, direct questions for comparison. (We built the IAT interviewing module from scratch to ensure it was seamless for participants and could be re-used cost and time effectively).
The results: the discounter ad had an immediate effect on the brand’s connection with viewers – around 10% more of the exposed group had a strong subconscious connection to the brand than the unexposed group – a swing that was not apparent in the direct questioning.
Perhaps more importantly, the IAT revealed specific drivers of closeness which were more emotionally grounded – elements that the ad clearly targeted in its messaging. Again these would not have been revealed using the traditional questionnaire results.
Finally, we found that individuals’ IAT scores had a strong positive correlation with shopping behaviour – so the unconscious connection also drives their everyday decisions.
The IAT technique provides us with an exciting new tool for brand and advertising research that:
There are some questions still unanswered: We measured immediate ad effect, but how does this decay and how many exposures prevent decay? And how does it work with less traditional media, in particular digital?
But one thing is clear from the research: The creatives are right! Good advertising has a clear effect on our unconscious connections with brands – something we should be striving to understand alongside our more traditional measures.